How to Use Renko Strategy AI Prompt for Smart Trading Decisions


Most traders waste hours staring at noisy candlestick charts, second-guessing every wick and shadow. Renko charts cut through that noise — and when you pair them with AI prompts, you get a systematic, repeatable edge that removes emotion from your trading decisions.
In this guide, you'll learn exactly how to use Renko strategy AI prompts on YROM to generate clear trade signals, define your entry and exit points, and manage risk — all without the analysis paralysis that kills most traders' performance.
What Is a Renko Chart — and Why It Matters
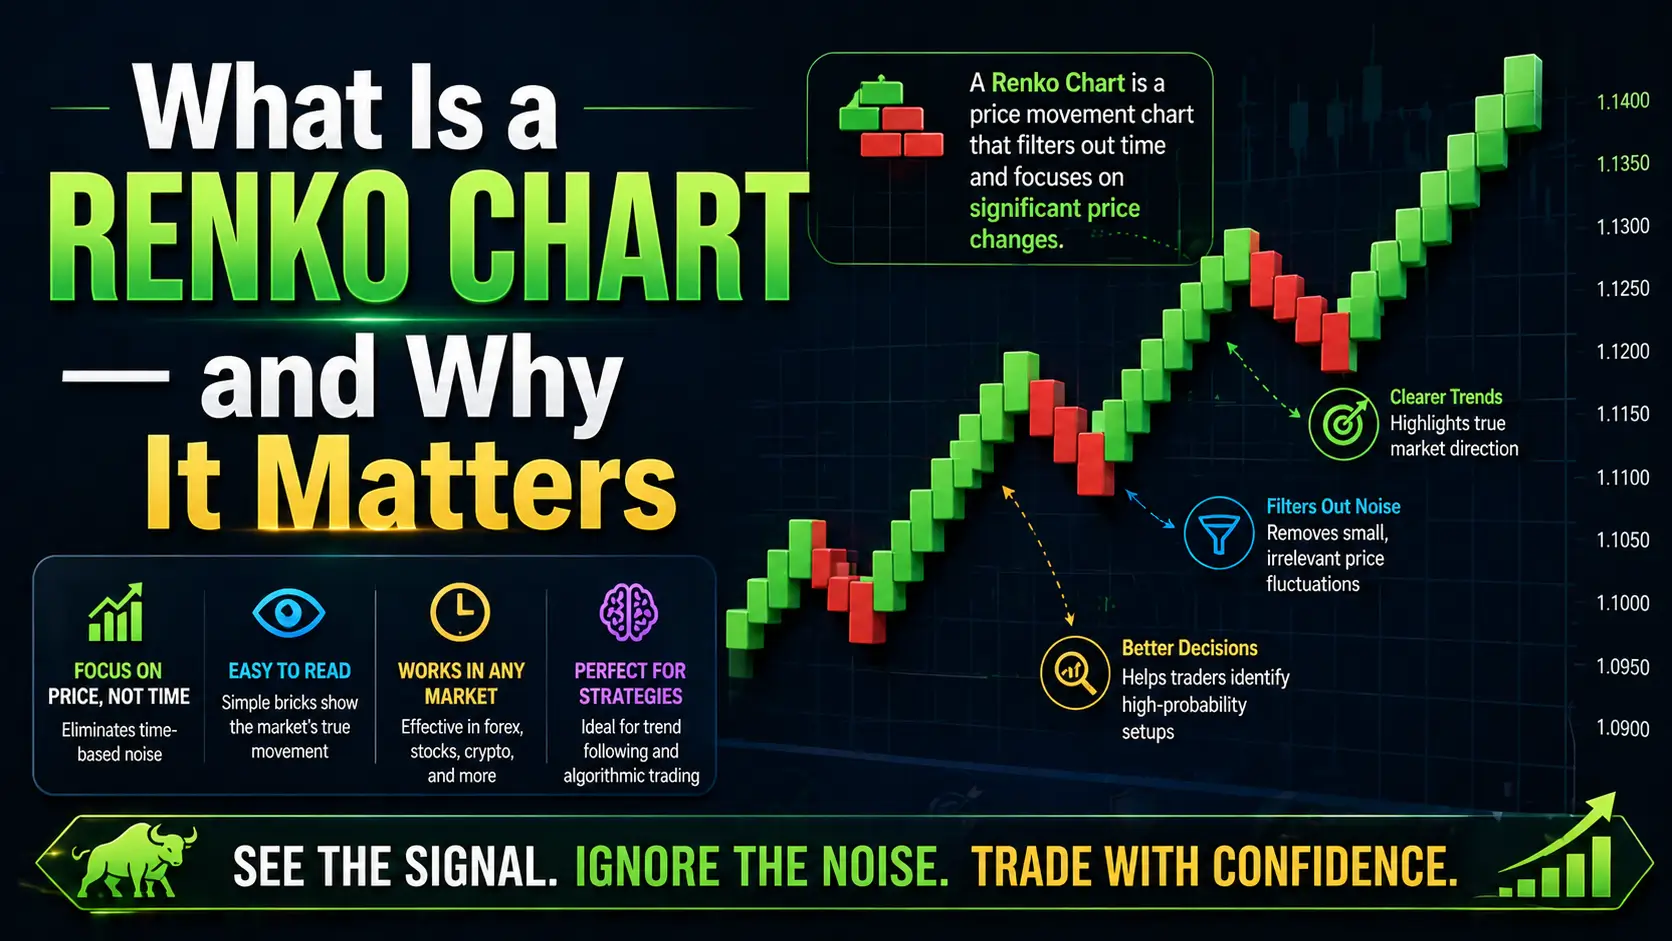
A Renko chart is a price chart built entirely from price movement — not time. Instead of plotting a new candle every minute or every hour, Renko charts only draw a new brick when price moves a fixed amount (called the "brick size").
This design choice has a powerful consequence: market noise disappears.
With traditional candlestick charts, a sideways, choppy market produces dozens of ambiguous candles. On a Renko chart, that same market might produce just two or three bricks, making the lack of trend immediately obvious.
Here's what makes Renko charts uniquely powerful for AI-assisted trading:
- Pure price signal: No time distortion — only meaningful price moves create new bricks
- Clear trend direction: Rising bricks (typically green) = uptrend; falling bricks (typically red) = downtrend
- Defined reversal signals: A color change in bricks signals a potential trend reversal
- Cleaner pattern recognition: AI models process Renko patterns with less noise interference than candlestick data
The tradeoff? Renko charts don't show exact timing, and choosing the wrong brick size can either over-smooth or over-complicate your view. That's where AI prompts become critical.
Why AI Prompts Transform Renko Analysis

Traditional Renko analysis requires a trader to manually:
- Choose the right brick size for their asset and timeframe
- Identify the current trend phase (early, mature, exhaustion)
- Spot reversal signals and distinguish them from false breakouts
- Calculate risk parameters based on brick size and volatility
- Make a buy/sell/hold decision
This takes experience, time, and emotional control — three things most traders struggle to maintain consistently.
AI prompts systematize this entire process.
When you feed a well-structured Renko strategy AI prompt to a model like YROM's built-in trading AI, it analyzes the current brick pattern, trend context, and volatility data simultaneously — and outputs a structured trade recommendation in seconds.
The key word is well-structured. A vague prompt like "analyze my Renko chart" produces generic advice. A properly engineered Renko strategy prompt extracts specific, actionable outputs: entry price, stop-loss level, target, position size, and the reasoning behind each.
How to Set Up Your Renko Chart Before Using AI
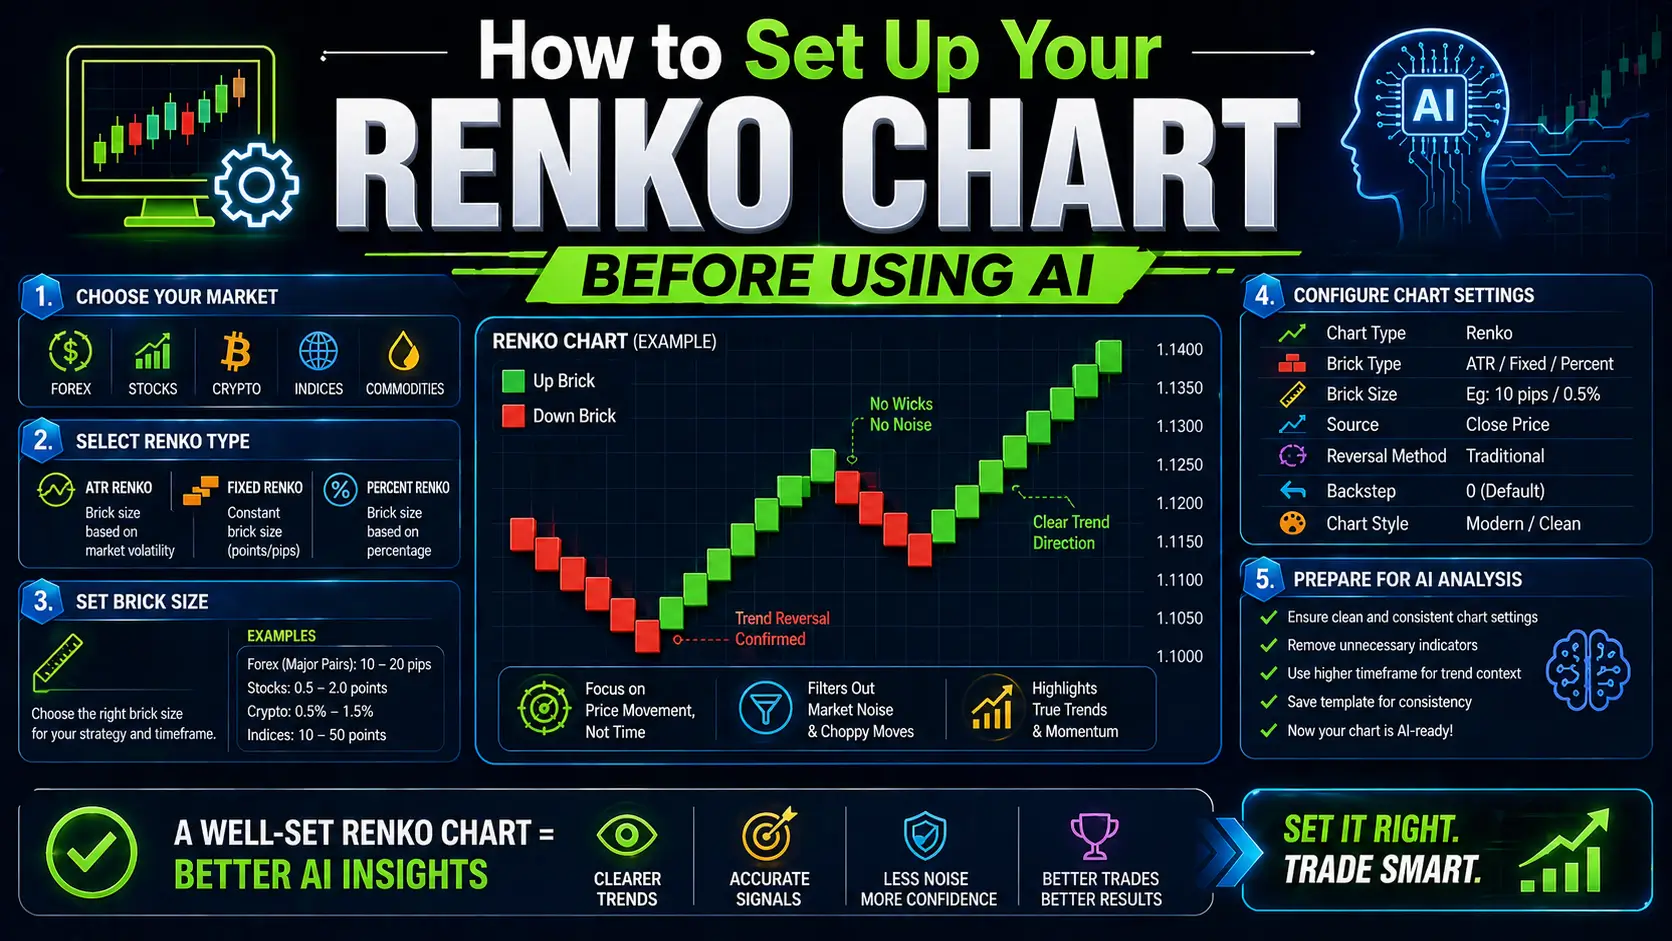
Before running any AI prompt, your Renko chart needs to be correctly configured. Garbage in, garbage out.
Step 1: Choose Your Brick Size
Your brick size determines how sensitive your chart is to price movement. Too small and you get too many bricks (noise); too large and you miss important signals.
General guidelines:
- Stocks (mid-cap): 0.5–1% of current price
- Crypto (BTC/ETH): $50–$200 per brick depending on volatility
- Forex major pairs: 10–20 pips per brick
- For beginners: Use ATR (Average True Range) × 0.5 as your starting brick size
YROM's Dynamic Brick Size Optimizer can automate this step — it calculates the optimal brick size based on the asset's 14-day ATR and adjusts as volatility changes.
Step 2: Identify the Current Brick Pattern
Before prompting AI, note the following from your current chart:
- How many consecutive same-color bricks are there? (3+ = established trend)
- Is the current brick completing, or has it just started?
- What is the most recent reversal pattern? (single reversal, double reversal, staircase)
- Are there any support/resistance zones formed by previous brick clusters?
Step 3: Note Key Context Variables
Your AI prompt will need:
- Asset name and current price
- Brick size in use
- Current trend direction (up/down/sideways)
- Number of consecutive bricks in current trend
- Your trading timeframe (scalp, swing, position)
- Risk tolerance (% of account you're willing to risk per trade)
With this information ready, you're set to use the AI prompt effectively.
The YROM Renko Strategy AI Prompt — Step by Step
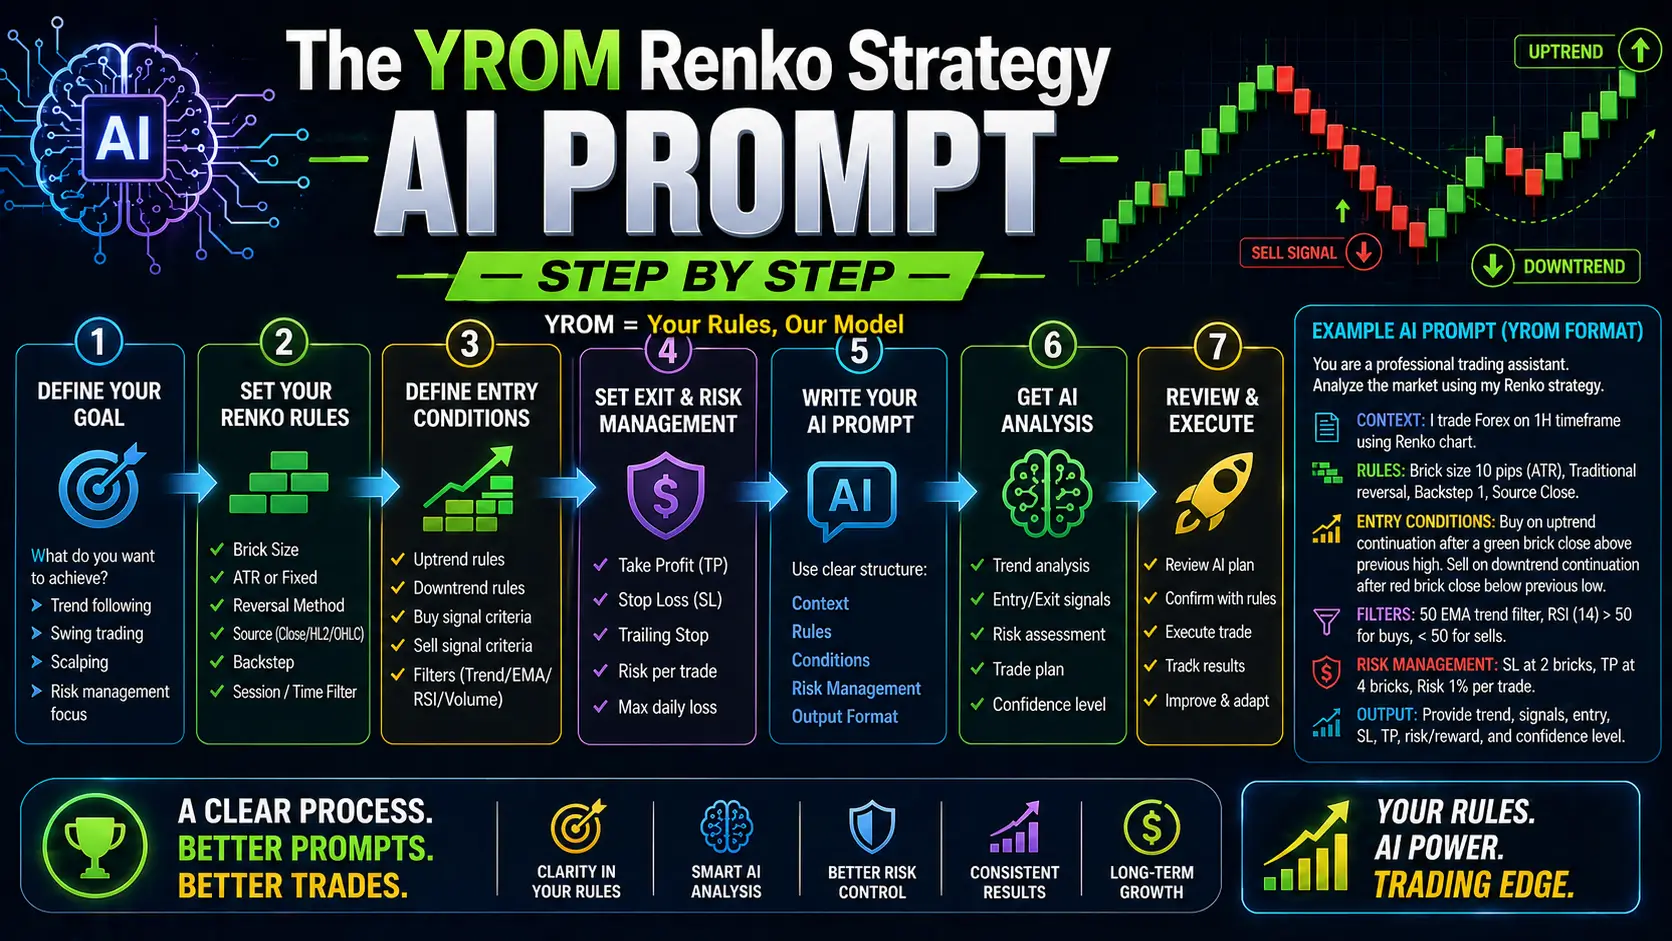
Here is the core Renko strategy AI prompt template used in YROM. You can use this directly inside the YROM platform or adapt it for your workflow.
The Base Prompt Template
RENKO STRATEGY ANALYSIS

Asset: [ASSET NAME] | Current Price: [PRICE]
Brick Size: [SIZE] | Timeframe context: [SCALP/SWING/POSITION]
Current trend: [UPTREND/DOWNTREND/SIDEWAYS]
Consecutive bricks in current trend: [NUMBER]
Recent pattern: [DESCRIBE: e.g., "5 green bricks, then 2 red, now 1 green again"]
Account risk per trade: [%]

Analyze this Renko setup and provide:
1. Trend strength assessment (strong/moderate/weak/exhausted)
2. Signal type (continuation / reversal warning / no signal)
3. Recommended action (BUY / SELL / HOLD / WAIT)
4. Entry price zone
5. Stop-loss level (based on brick reversal logic)
6. Take-profit target (primary and secondary)
7. Position size guidance based on stated risk %
8. Confidence level (high/medium/low) and primary reason
9. One thing that would invalidate this setup
Example: Live Prompt in Action
Let's walk through a real example.
Setup: You're trading ETH/USD. Current price is $3,200. You're using a $50 brick size. You see 7 consecutive green bricks, followed by 1 red brick forming (price moved $50 down). Your swing trading timeframe. You're risking 1% of your account.
Prompt input:
RENKO STRATEGY ANALYSIS

Asset: ETH/USD | Current Price: $3,200
Brick Size: $50 | Timeframe context: SWING
Current trend: UPTREND
Consecutive bricks in current trend: 7 green, now 1 red forming
Recent pattern: Strong staircase uptrend with 7 consecutive green bricks.
First red brick now printing. Previous resistance zone around $3,150.
Account risk per trade: 1%

Analyze this Renko setup and provide:
[full prompt template as above]
AI Output (YROM response):
RENKO ANALYSIS — ETH/USD

1. TREND STRENGTH: Moderate-to-exhausted
   7 consecutive green bricks indicates a mature uptrend. Brick count above
   5-7 typically signals momentum fatigue in swing timeframes.

2. SIGNAL TYPE: Reversal Warning
   The first red brick is forming. Not yet a confirmed reversal (requires 2
   consecutive red bricks) but warrants caution on new longs.

3. RECOMMENDED ACTION: HOLD existing longs. Do NOT enter new long positions.
   Wait for confirmation.

4. ENTRY ZONE (if confirmed reversal): Short entry on second consecutive red
   brick close, approximately $3,100–$3,150.

5. STOP-LOSS: $3,250 (one brick above the last green brick high)
   Logic: If price reverses back above $3,250, uptrend resumes.

6. TAKE-PROFIT:
   Primary: $2,950 (4 bricks down — 1:2.5 R:R)
   Secondary: $2,800 (6 bricks down — if momentum accelerates)

7. POSITION SIZE: With 1% account risk and $100 stop distance:
   Risk $100 on 0.1 ETH position (adjust to your account size)

8. CONFIDENCE: Medium
   Primary reason: Mature trend brick count + first reversal brick —
   classic Renko exhaustion pattern. But single red brick is not confirmation.

9. INVALIDATION: If the red brick does NOT complete (price recovers above
   $3,200 before closing a full brick), uptrend likely continues.
   Stand aside until next clean signal.
This is the power of a structured Renko AI prompt: you go from a chart to a complete trading plan in under 30 seconds, with every parameter defined.
Reading AI Prompt Outputs: What to Act On
Not every AI output is a trade signal. Knowing when to act — and when to wait — is what separates profitable use of AI prompts from reckless clicking.
Green Light: Act Now
Act on an AI output when all three of these align:
- Signal type is "continuation" with a strong trend (3+ consecutive same-color bricks)
- Confidence is "high"
- No active invalidation condition is present
Yellow Light: Wait for Confirmation
Wait when:
- Signal type is "reversal warning" — this means a signal may be forming, not that it has formed
- Confidence is "medium" — valid setup but ambiguous context
- Trend strength is "exhausted" — the move may be over but reversal isn't confirmed
The ETH/USD example above is a yellow light situation. The right response is to watch, not trade.
Red Light: Stand Aside
Do not trade when:
- Signal type is "no signal" — Renko chart is printing mixed bricks with no clear direction
- Confidence is "low"
- Asset is in a sideways/chop pattern — Renko strategy AI prompts work best in trending markets
Entry, Exit, and Risk Management with AI
The most valuable output from a Renko AI prompt isn't the buy/sell signal — it's the stop-loss logic, because Renko charts give you a mathematically clean basis for stop placement.
Stop-Loss Logic in Renko
In traditional charting, stop placement involves guesswork around wicks and volatility. In Renko:
- For long trades: Stop goes one brick below the last brick low
- For short trades: Stop goes one brick above the last brick high
This is logical and consistent. The AI prompt reinforces this by calculating the exact price level based on your brick size input.
Risk-Reward Calculation
YROM's AI prompt automatically calculates R:R based on your brick size and target:
- A trade risking 1 brick targeting 2.5 bricks = 1:2.5 R:R
- A trade risking 1 brick targeting 4 bricks = 1:4 R:R
For swing traders, aim for a minimum 1:2 R:R. For scalpers, 1:1.5 can work if your win rate exceeds 55%.
Position Sizing Formula
The AI prompt uses this formula when you provide your risk percentage:
Position Size = (Account Size × Risk %) ÷ (Stop Distance in $)
If your account is $10,000, you risk 1% ($100), and your stop is $50 away:
Position Size = $100 ÷ $50 = 2 units
This keeps your risk consistent regardless of brick size or asset price.
Common Mistakes Traders Make with Renko AI Prompts
Mistake 1: Acting on Reversal Warnings as Confirmed Signals
A "reversal warning" means one brick has changed color. Renko strategy requires two consecutive opposite-colored bricks to confirm a reversal. Entering on the warning (one brick) means you'll get chopped out of trades in volatile, meandering markets.
Fix: Set your AI prompt to require confirmation before flagging a reversal as actionable. In YROM, this is configurable in your prompt settings.
Mistake 2: Using Renko AI Prompts in Sideways Markets
Renko charts are trend-following tools. In sideways markets, brick color flips back and forth producing a confusing mess of signals. AI prompts on these charts output low-confidence, contradictory signals — not because the AI is wrong, but because the chart genuinely has no signal.
Fix: When the AI outputs "signal type: no signal" or "confidence: low," simply wait. Don't force a trade.
Mistake 3: Ignoring the Brick Size Input
Using the wrong brick size makes everything downstream incorrect. A brick size too small on a volatile asset generates rapid alternating bricks that produce false reversals. A brick size too large on a quiet asset produces almost no bricks at all.
Fix: Always re-check your brick size setting before running the prompt, especially after a period of elevated volatility. Let YROM's Dynamic Brick Size Optimizer recalibrate for you.
Mistake 4: Skipping the Invalidation Condition
Every AI output includes an invalidation condition — the specific price action that would make the current setup wrong. Traders who ignore this condition hold losing trades well past their stop because they "believe in the setup."
Fix: Write down the invalidation condition before you enter the trade. If that condition triggers, exit — no debate.
Mistake 5: Over-Prompting for Reassurance
Some traders re-run the AI prompt every few minutes hoping for a "better" answer when the first output was a hold or wait signal. This is AI-assisted bias confirmation and leads to overtrading.
Fix: Run the prompt once per brick close. Trust the output. Re-run only when a new brick prints.
Frequently Asked Questions (FAQs)
What is a Renko strategy AI prompt?
A Renko strategy AI prompt is a structured input you give to a trading AI (like YROM) that describes your current Renko chart setup — brick size, trend direction, pattern — and asks the AI to output a complete trade plan including entry, stop-loss, target, position size, and confidence level.
Do I need trading experience to use Renko AI prompts?
Basic chart literacy helps, but the AI prompt template walks you through every input you need to provide. The AI handles the analysis. Beginners should start by using the outputs as education (understanding the reasoning) before trading real capital.
What markets work best with Renko strategy AI prompts?
Renko AI prompts work best in trending markets: trending stocks, trending crypto pairs (BTC, ETH), and forex pairs with clear directional momentum. They are less effective in low-volatility, sideways markets.
How is YROM's Renko AI different from just using ChatGPT?
YROM's AI prompts are trained and optimized specifically for Renko chart analysis and trading decision frameworks. Generic AI models lack the domain-specific trading context, risk calculation logic, and brick-size calibration that YROM's engine provides.
How often should I run the Renko strategy AI prompt?
Once per brick close is the recommended cadence for swing traders. Scalpers can run it more frequently, but over-prompting introduces noise. Set a discipline: one prompt per new confirmed brick.
Can Renko AI prompts guarantee profitable trades?
No AI system — including YROM — can guarantee profits. Renko strategy AI prompts improve your decision quality and consistency, but all trading involves risk. Always use the position sizing and stop-loss outputs from the AI to manage your downside.
What is the minimum brick size I should use?
There's no universal minimum — it depends on the asset. As a rule, your brick size should be at least 0.5% of the asset's current price to filter out meaningful noise. For highly volatile assets like small-cap crypto, consider 1–2% per brick. Use YROM's Dynamic Brick Size Optimizer to get an automated recommendation.
Start Trading Smarter with YROM's Renko AI
Renko charts give you signal clarity. AI prompts give you analytical speed. Together, they give you something most traders never achieve: a systematic, repeatable, emotion-free trading process.
The template in this guide is a starting point. The more precisely you describe your chart setup in your prompt inputs, the more precise and actionable your AI outputs will be.
Try YROM free and run your first Renko strategy AI prompt today. Your first analysis takes under 60 seconds.
This article is for educational purposes only and does not constitute financial advice. Trading involves substantial risk of loss.